AEROSPACE TECHNOLOGIES
Your browser is not supported.
For the best experience, please access this site using the latest version of the following browsers:
By closing this window you acknowledge that your experience on this website may be degraded.
Radar Corner
Radar Corner
Weather Radar Modes - Which mode, when?
Our last article discussed some radar fundamentals – antenna beamwidth and reflectivity. We also looked at basic techniques for storm cell detection and analysis. In this article we’ll look at some of the radar modes and features available on different platforms. Many of these features automate the tasks described in the previous article, so this article will make more sense after viewing the previous one.
Figures 1 and 2 show Honeywell’s legacy radar systems on business and general aviation aircraft including the AlliedSignal/BendixKing RDR-2100/2060/2000 radars and the Honeywell Primus-880/660/440 radars. This article will look at these features, what they do, and their intended purpose.
Figure 1. BendixKing Radar Systems
Figure 2. Honeywell Primus Radar Systems
We use weather radar for detection, analysis, and avoidance with the first step being detection. In the previous article we talked about the cruise ground park technique. Start with the tilt all the way down (-15 degrees) and slowly raise the beam until you see ground returns at the outer edge of the display. There are three main benefits to this technique. First, by starting with the beam fully down you won’t scan over cells close to the aircraft. Second, any storm cells will walk out of the ground returns making them easy to identify. And, if you can still see ground returns behind the cell then you know your energy hasn’t been attenuated (radar shadow) and that it is an accurate representation of the cell. If you can’t see the ground returns the cell may be stronger or extend further than it appears.
Figure 3. Cruise Ground Park Technique
Detection is our first step, and AutoTilt is our first mode. Honeywell has different versions of AutoTilt because of the legacy Honeywell and BendixKing companies. Both AutoTilt functions emulate the cruise ground park technique but in a different way. The BendixKing radars use the same process as you would if manually setting the tilt. Tilt down to -15 degrees to avoid over scanning any cells and then slowly raise the tilt until the desired amount of ground return is obtained at the outer edge of the display. Now enable AutoTilt and the antenna position will automatically be adjusted to maintain the same intercept angle as the aircraft climbs and descends. Remember that the amount of ground returns that you see will vary because of their reflectivity (i.e. cities, lakes, crops, etc). The Primus radars automatically set tilt based on the aircraft’s altitude, range selection, and even accounts for the earth’s curvature. Again, the amount of ground return shown will be dependent on the reflectivity. Once you are in AutoTilt mode on the Primus radars the tilt knob can be used to fine tune the tilt by +/- 2-degrees. This allows the pilot to adjust the amount of ground return seen on the display.
Figure 4. Primus Radar Altitude Compensated Tilt (ACT) Function
The other main benefit of the cruise ground park technique is that radar shadows (attenuation) can easily be identified. Both systems have similar attenuation detection features - ARL and REACT. ARL, or Automatic Range Limiting makes attenuated areas more apparent. In ARL mode the system determines the range at which radar energy is insufficient to penetrate further and paints the remainder of the radial in cyan. You have no idea what is in these shadowed areas, so you should never fly into them, or the highly reflective cell in front that caused the shadow. REACT, or Rain Echo Attenuation Compensation Technique works in much the same way but shows not only the azimuth of the attenuation, but the range where it occurs as well. In the picture on the right attenuation starts immediately following the strong cell on the left, but further to the right the attenuation isn’t as strong and is a true representation of the red reflectivity weather up to where the cyan marks begin.
Figure 5. ARL and REACT Attenuation Detection Feature
Integrated displays provide greater situational awareness, but the range selection used for TCAS, EGPWS, or while reviewing approach waypoints might not be compatible with those required for viewing weather. We generally recommend that the pilot monitoring (PM) be on a range setting at least one range higher than the pilot flying (PF). While the PF is looking tactically the PM can be monitoring the weather strategically. The Target Alert feature monitors weather ahead of the aircraft and provides an alert for potential severe weather in the flight path, but that is detected beyond the current display range. When a target is detected of red intensity meeting certain size criteria the WX display provides an indication to the crew. When the radar range is changed to include the selected target, or the target decreases in intensity and no longer satisfies the criteria, the target alert is removed.
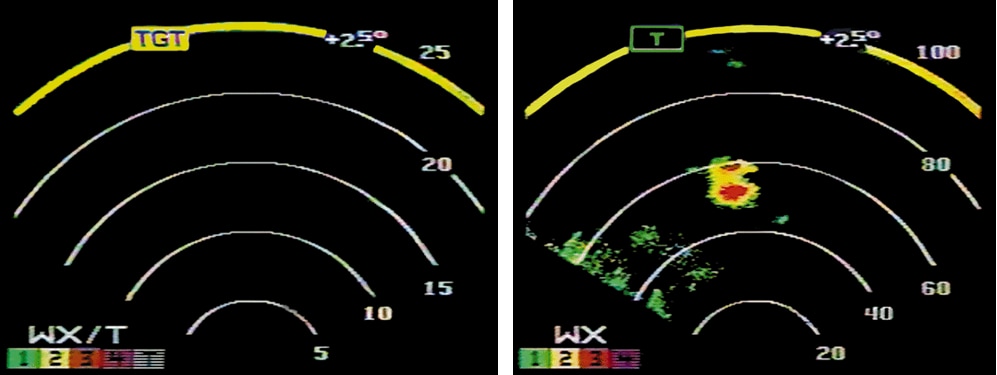
Figure 6. Target Alert
After a cell has been detected in your path analysis must be performed to determine if avoidance is needed. There are several tools that can aid in this task. Sector scan provides a reduced 60-degree scan angle providing faster updates while you manipulate the tilt control. During analysis we’re primarily concerned with reflectivity, but more importantly we want to look at how much reflectivity is carried aloft and how much reflectivity there is above the freezing level. We’re looking at two items. First, where the higher reflectivity ends (yellow & red) and where the wet top ends (green). The higher these areas extend above the freezing level the more dangerous the cells are. In the previous article we described a method using manual tilt to get a rough estimate of the tops. In addition to the manual tilt control the BendixKing radars provide modes to look at the vertical extent of cells and the reflectivity carried aloft. They provide a vertical profile mode which provides a visual depiction of the reflectivity carried aloft, and the RDR-2100/2060 provide an Auto Step Scan mode. Auto Step Scan and Vertical profile both provide vertical information, they just do it differently. Auto Step Scan can be considered a combined detection and analysis mode. Rather than going in and out of cruise ground park to evaluate cells let Auto Step Scan do both functions for you automatically and continuously. In Auto step scan mode, the system continuously scans horizontally and vertically from -10⁰ to +10⁰. Simply observe the display and the tilt angle and you can gauge the reflectivity and vertical extent as the scan progresses. The difference between this and Vertical Profile mode is that it is doing it across the entire plan view of the display whereas the vertical profile mode only provides a picture along the selected azimuth. In a way this mode provides detection, analysis, and avoidance information. Areas shown of no, or low tops provides a deviation path. Auto Step Scan causes the antenna tilt to sequentially step in 4° increments. If an area needs more analysis Vertical Profile mode can be used.
Figure 7. Auto Step Scan Mode
The Vertical Profile (VP) mode provides a direct means of displaying the vertical characteristics of the weather cell. Storm characteristics of particular interest to the pilot include relative height, slant, shape, vertical development, and the area of most concentrated precipitation within the storm. In addition to providing information about the storm’s vertical characteristics, the pilot can now easily distinguish between ground or sea returns and actual weather. Vertical profile mode provides an image of what we are trying to create in our heads while using manual tilt or Auto Step Scan. We’re presented with an image of the cell and how much reflectivity is carried aloft. As a refresher, in the cumulous stage warm moist air rises in updrafts. As the water starts to condense it gives off latent heat providing more energy and lift. In the mature stage the particles become heavy enough that the updrafts can’t support the weight and they begin to fall to the ground. This is the nasty part of the storm with updrafts, downdrafts, turbulence, hail, and lightning. In the dissipating stage downdrafts squash vertical development and upper-level winds give us the typical anvil shape. The reason we want to look at the tilt of the cell is because it generally gives us clues if this is an airmass/popcorn thunderstorm or a more severe thunderstorm. An airmass thunderstorm in generally not associated with upper-level winds and follows the process just described. More severe cells generally lean or tilt because of stronger upper-level winds. The rain and downdrafts come out ahead of the cell providing a fuel source, but more importantly the downdraft doesn’t squash the updrafts. This allows the cell to grow stronger and last much longer than a typical airmass thunderstorm.
Figure 8. Vertical Profile Mode
Operation of Vertical Profile will depend on your installation. The process starts by selecting an azimuth where the antenna will stop scanning horizontally and start scanning vertically once VP mode is selected. This will normally be named Azimuth Select, Selected Azimuth or Track (TRK) Line. An additional benefit of VP mode is that you aren’t limited to +/-15⁰ of tilt. In VP mode the antenna can scan +/-30⁰ allowing the system to see higher, lower, and closer to the aircraft. At low altitude this is important to detect cells that may be above you. We’ve mentioned several times that we want to look at how much reflectivity is carried aloft. Studies have shown that airmass or popcorn cells usually develop at 15 to 20,000 feet and descend to the ground, whereas supercells develop at higher altitudes (25-35,000’) and descend to the ground more rapidly.
Figure 9. Selecting Azimuth for Vertical Profile
Recall from our previous article that the radars energy is strongest in the center of the radar beam and tapers off radially. As the antenna sweeps up and down this increase and decrease from the weak edges to the strong center causes the ground returns to go from black, green, yellow, red, magenta, and then on the other side show the exact opposite, creating a symmetrical image. This is how you identify ground returns.
Figure 10. Symmetrical Beam
The area where returns are non-symmetrical indicate weather. The non-symmetrical areas can vary depending on the height of the weather.
Figure 11. Determining Weather and Ground returns
The last feature I’ll mention is antenna stabilization because it is often mis-understood. The purpose of antenna stabilization is to maintain the antenna scanning relative to the horizon regardless of the attitude of the aircraft. If 0-degrees tilt is set it doesn’t matter if the aircraft pitches up 10-degrees and rolls 30-degrees right, the antenna will continue to scan 0-degrees relative to the horizon. If stabilization fails, or is turned off, the antenna will scan relative to the longitudinal axis of the aircraft. Of course, there are limits, usually expressed in terms of pitch, roll and combined pitch and roll. However, if you exceed those pitch and roll limits, weather detection is probably the least of your problems.
Figure 12. Antenna Stabilization
We’ll close by reminding you that radar is an analysis and avoidance tool. It should never be used for the pre-planned penetration of storms. However, in the event of required navigation in areas of bad weather, the proper use of these tools can reduce the likelihood of encountering excessive precipitation and turbulence. Vertical Profile mode greatly simplifies the task of determining vertical characteristics of a storm by pictorially displaying a vertical slice of the cell and showing its radar height. The accuracy of radar height measurements is limited by beamwidth which increases with range. Cloud tops composed of ice crystals or dry hail, both of which have low radar reflectivity, or storm associated turbulence without precipitation may extend several thousand feet or higher above wet tops. Appropriate caution must be exercised when attempting to overfly any cell which exhibits high radar reflectivity or extends above the freezing level. Vertical Profile is not intended to measure the absolute height of a storm although it can be useful in determining relative radar heights of different cells.
Program Pilot Stephen Hammack supports Honeywell Apex and radar for Flight Technical Services. He can be reached via email at stephen.hammack@Honeywell.com.
